Application settings
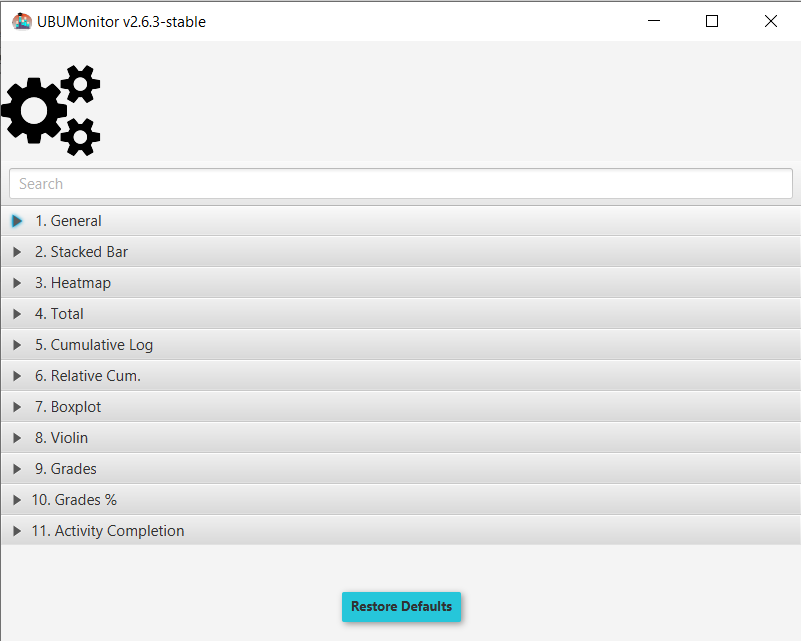
In the Tools menu, the advanced option Change configuration is available. This option allows you to customize the initial default values in some displays for the current subject (each subject can have its own settings).
Settings
The configuration modal dialog enables text search. The changes are saved when the dialog is closed. If the initial values are to be restored, the Restore Defaults button must be selected.
The dialog shows the following sections:
General
- File encoding: character set to be used in the export of the generated
CSVfiles. - Cut-off mark: minimum mark that marks the qualification items or not.
- Line width
- Line spacing
- Chart legend
- General statistics
- Group statistics
- Initial Roles: Selection of roles that are initially marked in the filter by roles.
- Initial groups: selection of groups that are initially marked in the group filter
- Last connections: selection of last connection that is initially marked in the filter.
- Default time unit
- Y-axis title
- X-axis title
- Y-axis font color
- X-axis font color
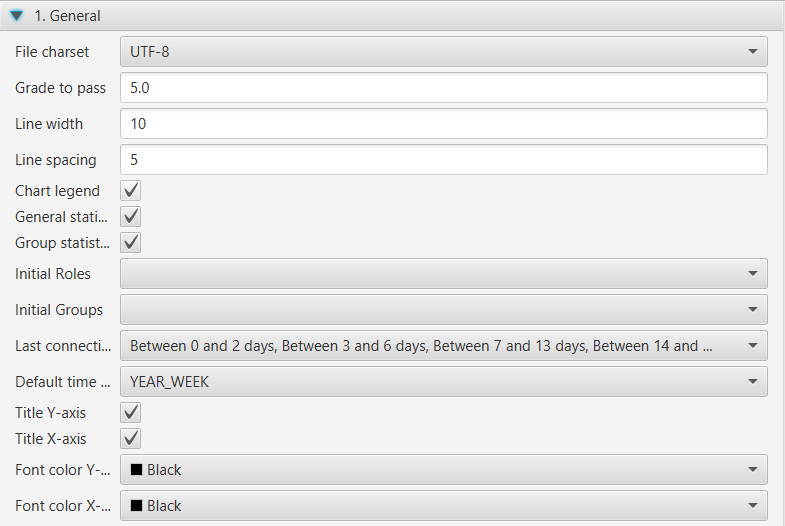
General settings

Heatmap
- Calculate maximum: activates automatic calculation.
- With quartiles: calculates the ranges from the quartiles of the current sample, instead of dividing the range into four equal parts.
- Zero value
- First interval
- Second interval
- Third interval
- Fourth interval
- Maximum
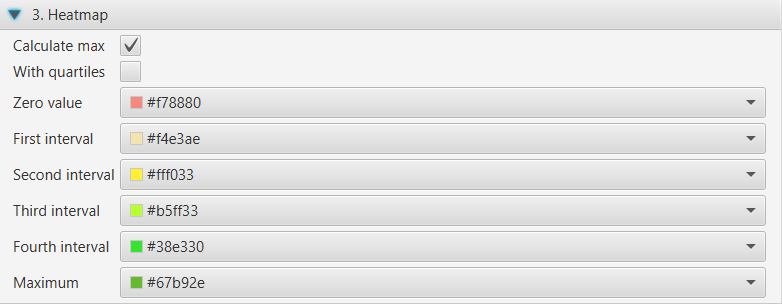
Heatmap


Rel. Cumulatives
- Calculate maximum: activates automatic calculation.
- Zero line color: color applied to the line representing the average
- Zero line width
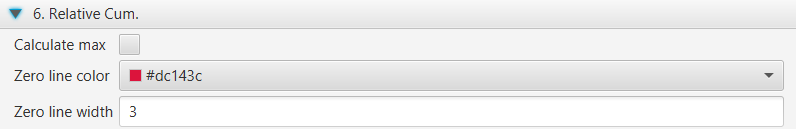
Rel. Cumulative
Boxplot
- Horizontal mode: changes the display of the boxplot to horizontal mode.
- Decimal information: number of decimals to be displayed in the tooltips with the statistical data.
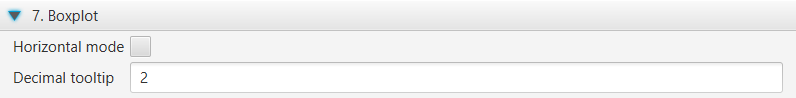
Boxplot
Violin
- Horizontal mode: changes the display of the violin to horizontal mode.
- Decimal information: number of decimals to be displayed in the tooltips with the statistical data.
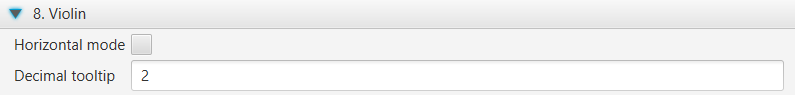
Violin
Grades
- Fail grade color: taking into account the cut-off grade set in the General section.
- Passed grade color: taking into account the cut-off grade set in the General section.
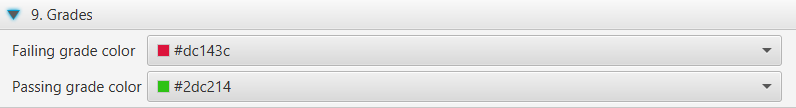
Grades
Grades %
- Empty rating color
- Fail grade color: taking into account the cut-off grade set in the General section.
- Passed grade color: taking into account the cut-off grade set in the General section.
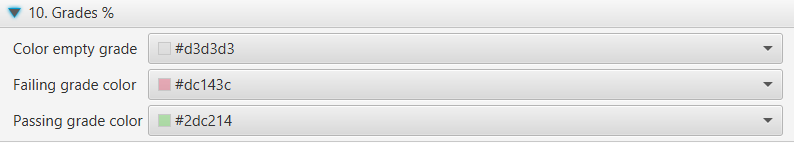
Grades %
Activity Completion
Set the colors for the different intervals of the progress bar.
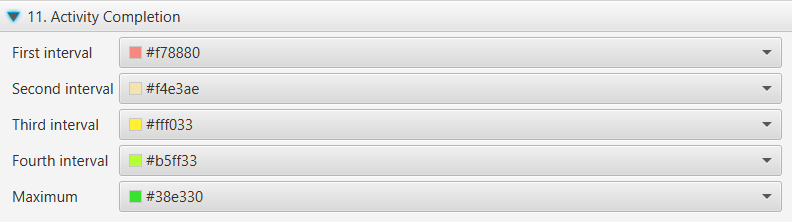
Activity Completion