Activity completion visualization
The activity completion shows the current status of each activity, on which tracking has been activated.
For each activity its status is shown, with a green stick if it is completed, with a red cross if it has been done, but not exceeded, and in blank if it has not been done. If we position the cursor in any of the boxes, a tooltip shows the date and time of completion.
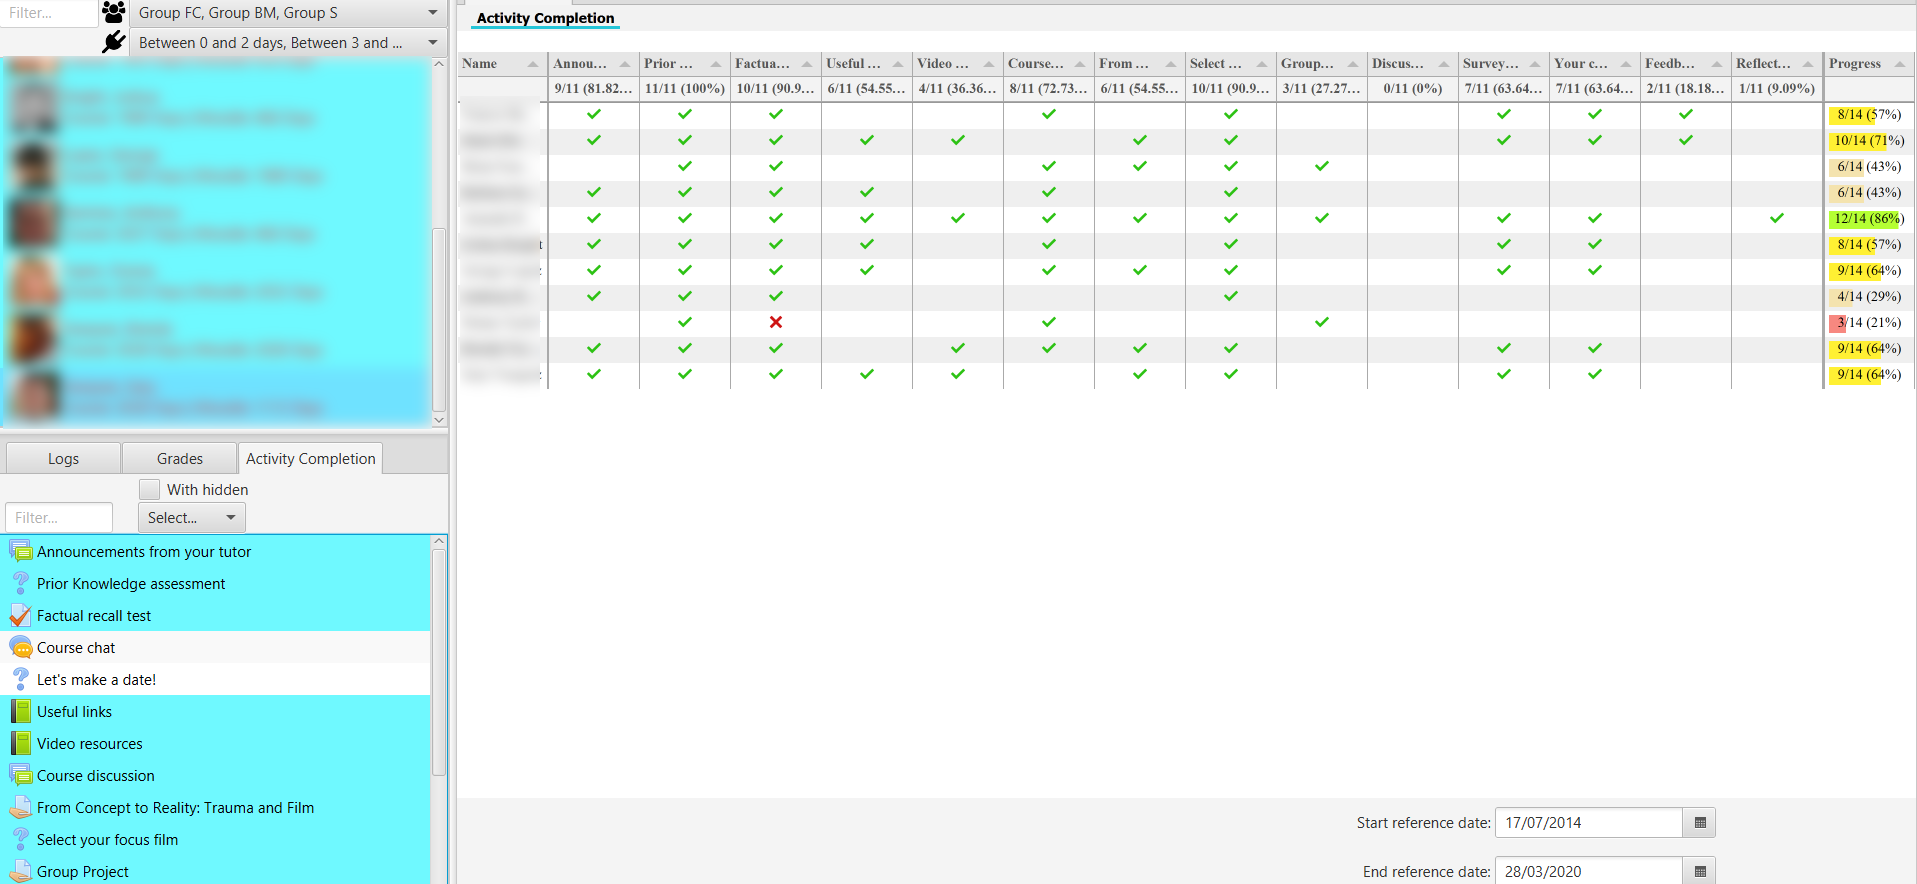
Activity completion table
The last column shows the progress of the number of activities for each user, with the number completed of the total and the percentage. The progress bar is coloured according to the percentage (i.e. in the default setting you have red < 25%, salmon between [26%, 50%], yellow between [50%, 75%], light green between [75%, 99%] and dark green for 100%).
In the header of each column the number of users who have completed the activity and the percentage of the total number of users are shown.
You can apply the filter by date to display only the completion of activities within the marked range, allowing you to view the specific snapshot, at a particular moment in time.
It allows the alphabetical, temporal or numerical sorting according to the name column, item or percentage respectively.
VERY IMPORTANT: to display this table it is necessary to activate in Moodle, in Edit settings of the course, in the section Completion tracking, the option Enable completion tracking. Once you have made this change, it is recommended that you adjust the Completion Tracking option for each activity and resource, if you want to collect and display the tracking data.